
Bounce rate in Google Analytics has always been a slightly divisive metric; many would say it’s a core metric to focus on and monitor, but many others argue looking at bounce rate in isolation is actually unwise. I’d say there’s been a definite shift to the latter view in recent years as our collective understanding of user behaviour online has improved.
Now with the upcoming sunset of Google Universal Analytics and the inevitable push to switch to GA4 (where bounce rate essentially no longer exists), I’ve seen an increasing amount of discussion online regarding the value and issues associated with bounce rate as a metric; even the legendary (now retired) analytics expert Ali G has a view:
As someone never afraid to jump on a bandwagon, I thought I’d pen a few thoughts myself based on my experience, particularly in the ecommerce space.
p.s. You’ll be amazed to know, no professional video editors were harmed (or indeed used) in the making of the above video.
What actually is bounce rate?
For Universal Analytics, Google defines bounce rate as:
…the percentage of all sessions on your site in which users viewed only a single page and triggered only a single request to the Analytics server
Bounce rate (google.com)
Put simply, if a user visits your site, stays only on the page they originally landed on, plus doesn’t trigger any events before leaving, they’ll be defined as a bounce. It’s important not to confuse bounce rate with exit rate in Universal Analytics, as they’re not the same thing.
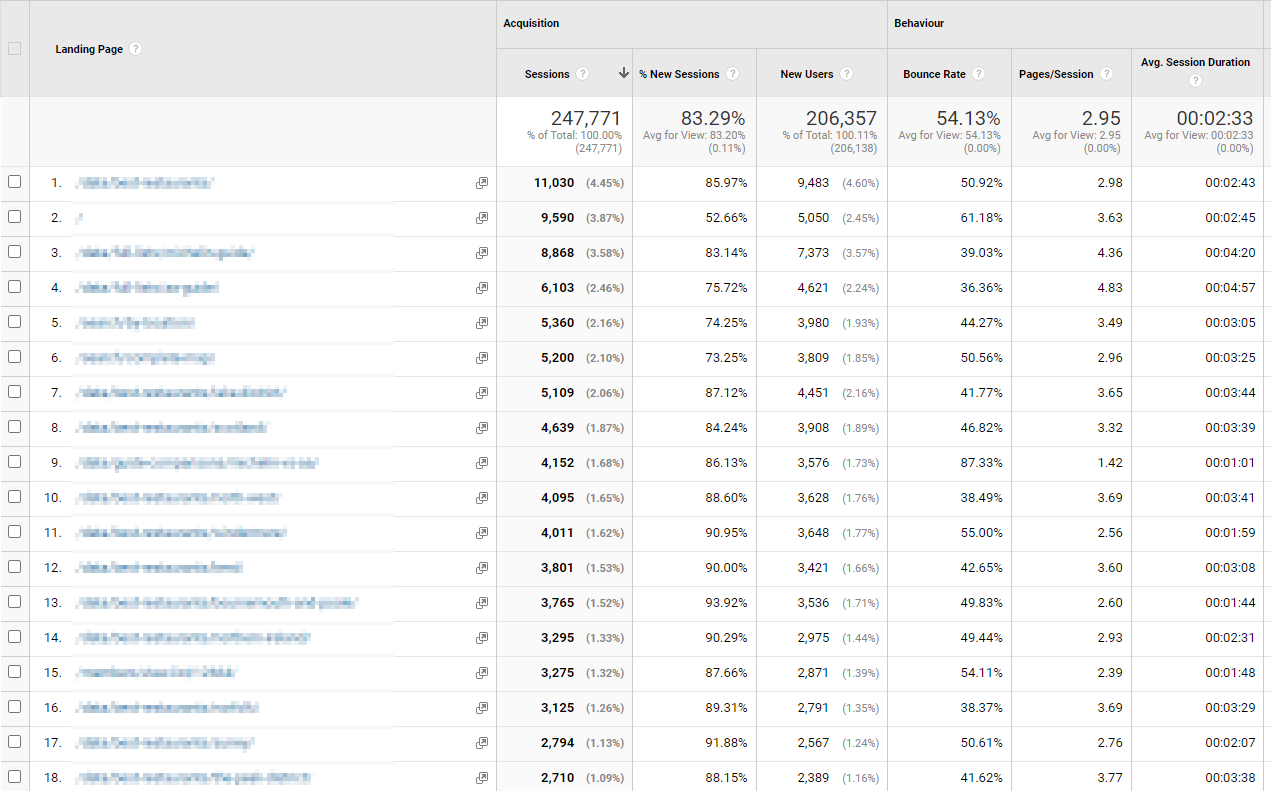
The bounce rate metric is available on a range of reports in Universal Analytics; you can see bounce rate by source, medium, channel and more, but most typically for ecommerce sites, you’ll probably be accustomed to viewing bounce rate by page (or perhaps content group):
So, what’s the problem?
I actually think Google themselves sum up the issue with bounce rate as a metric pretty well:
Bounce rate, as it’s calculated in Universal Analytics, is a reasonable measure of site engagement, but it has become less useful as websites and apps have changed.
[UA→GA4] Comparing metrics (google.com)
Bounce rate in isolation has never been a brilliant metric, but over the past 10 years or so there have been significant changes to how users typically interact with websites. I also feel there’s been an increase in the level of understanding for professionals whose job entails looking at bounce rate as a metric.
There have always been many common scenarios where a high bounce rate is not a bad thing; for example if you’re running an affiliate portal, or a voucher code site, or even an informative blog, if the visiting user can find what they need on the very first page they land on, you’ll probably be looking at that as a positive result.
Where that increase in understanding I mentioned above really plays out is when looking at bounce rate as a metric for ecommerce sites. The biggest issue with relying on bounce rate in isolation as a metric from an ecommerce perspective is that a bounce doesn’t necessarily indicate a lack of intent to buy. Consider the following two example customers on an ecommerce site:
Customer 1
- Lands on a product page from Google Shopping
- Looks for a few seconds then clicks through to another product page on the same site
- Has a brief read but then leaves the site never to return; they’re Gone in 60 Seconds

Customer 2
- Lands on a product page from Google Shopping
- Scrolls up and down the page repeatedly, carefully reading all the information provided
- Moves their mouse out of the browser window to open a new tab and search on Google for comparable products, before re-entering the same tab again for further reading
- Bookmarks the page in their browser
- Prints a copy of the page (OK OK, I’m getting extreme now, but you get the idea)
- All in all spends 25 minutes on the page before closing their browser
Which customer should you be more worried about? Who do you think is more likely to return in future and purchase again? It’s obvious isn’t it, yet Customer 1 in Universal Analytics would be classed as a non-bounce and Customer 2 would be classed as a bounce.
The behaviour of Customer 2 is far from atypical in modern ecommerce, and that’s where a key issue with relying on bounce rate as a metric in isolation stems from. But hey, even if you disagree and think bounce rate is a brilliant metric for ecommerce, it’s gone in GA4, so you better get used to it!
What has replaced bounce rate in GA4?
Bounce rate has been replaced in GA4 by engagement rate. Google’s official GA4 documentation describes engagement rate as follows:
Engagement rate is the percentage of sessions that were engaged sessions.
An engaged session is a session that lasts longer than 10 seconds, has a conversion event, or has at least 2 pageviews or screenviews.
[GA4] Session (google.com)
The key difference here is that the session time is incorporated by default into the metric; if a user spends more than 10 seconds on the page they land on, that counts as an engaged session, even if they take no other action on the site whatsoever. If you took out the session time check, engagement rate in GA4 would (more or less) be the inverse of bounce rate in UA.
So all things considered, is engagement rate a better metric than bounce rate?
The short answer is yes, I think it is. On a really basic level, Customer 2 from my example above will at least count as an engaged user in GA4 whereas in UA they would have been classed as a user who bounced. Although it’s worth noting, Customer 1 from that example will still be classed as engaged too.
But, I still have a lot of issues with this as a metric. Firstly, does 10 seconds on a landing page really mean a user is engaged? To me it feels like a horribly arbitrary amount of time, invented by an engineering team (I used to be a dev so I’m allowed to say that) rather than it being based on any kind of analytical data. If Google had come out and said “Choosing 10 seconds to represent an engaged session is based on our analysis of billions of data points over the past 10 years”, I’d be calling BS.
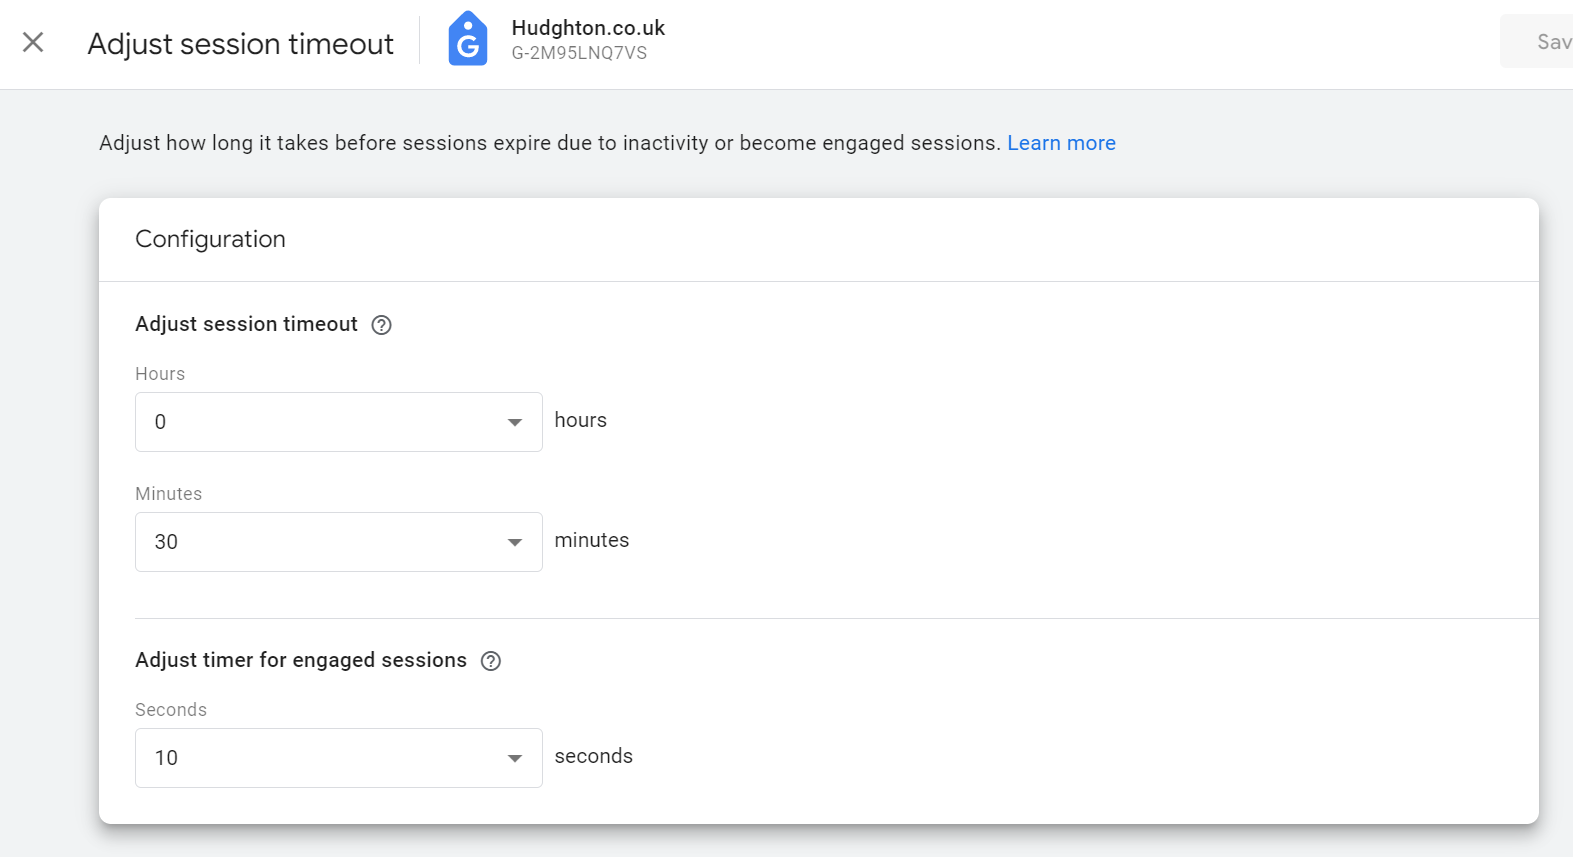
You can of course change the default timer for engaged settings for any GA4 property, although it’s tucked away in the back corridors of GA. To access the relevant setting, you’ll need to go to:
Admin -> (Click your property) -> Data Streams -> Web -> (Click your web stream) -> Configure tag settings -> (Click ‘Show all’ under Settings) -> Adjust session timeout
which will present you with this screen:
But is the time spent by a user on a landing page really enough to indicate engagement? I’m sure I’ve opened sites thousands of times but then been distracted before actually doing anything. I would have loved to have seen something a bit more advanced here to indicate an engaged session, such as a combination of not just time on page but also:
- Scroll depth
- Mouse exits and re-entries to the same tab
- Non-event-triggering on page clicks (e.g. zooming on an image)
Of course, bundling all that into one metric is a lot more difficult than just saying “10 seconds on the page = engagement, mate” and I appreciate there’s no one-size-fits-all solution that’s going to be right for every site.
And yeah, I know Google Analytics is free (mostly) so we can’t really complain, and other platforms for web analytics are available, but with all the furore over GA4, my personal view is Google could have done a lot better here.
How do you view engagement rate (bounce rate) by landing page in GA4?
As I mentioned above, viewing bounce rate by landing page is probably a report you looked at pretty frequently in Universal Analytics if you work in ecommerce. However, one thing you’ll learn quickly when using GA4 is that many of the standard reports from UA no longer exist.
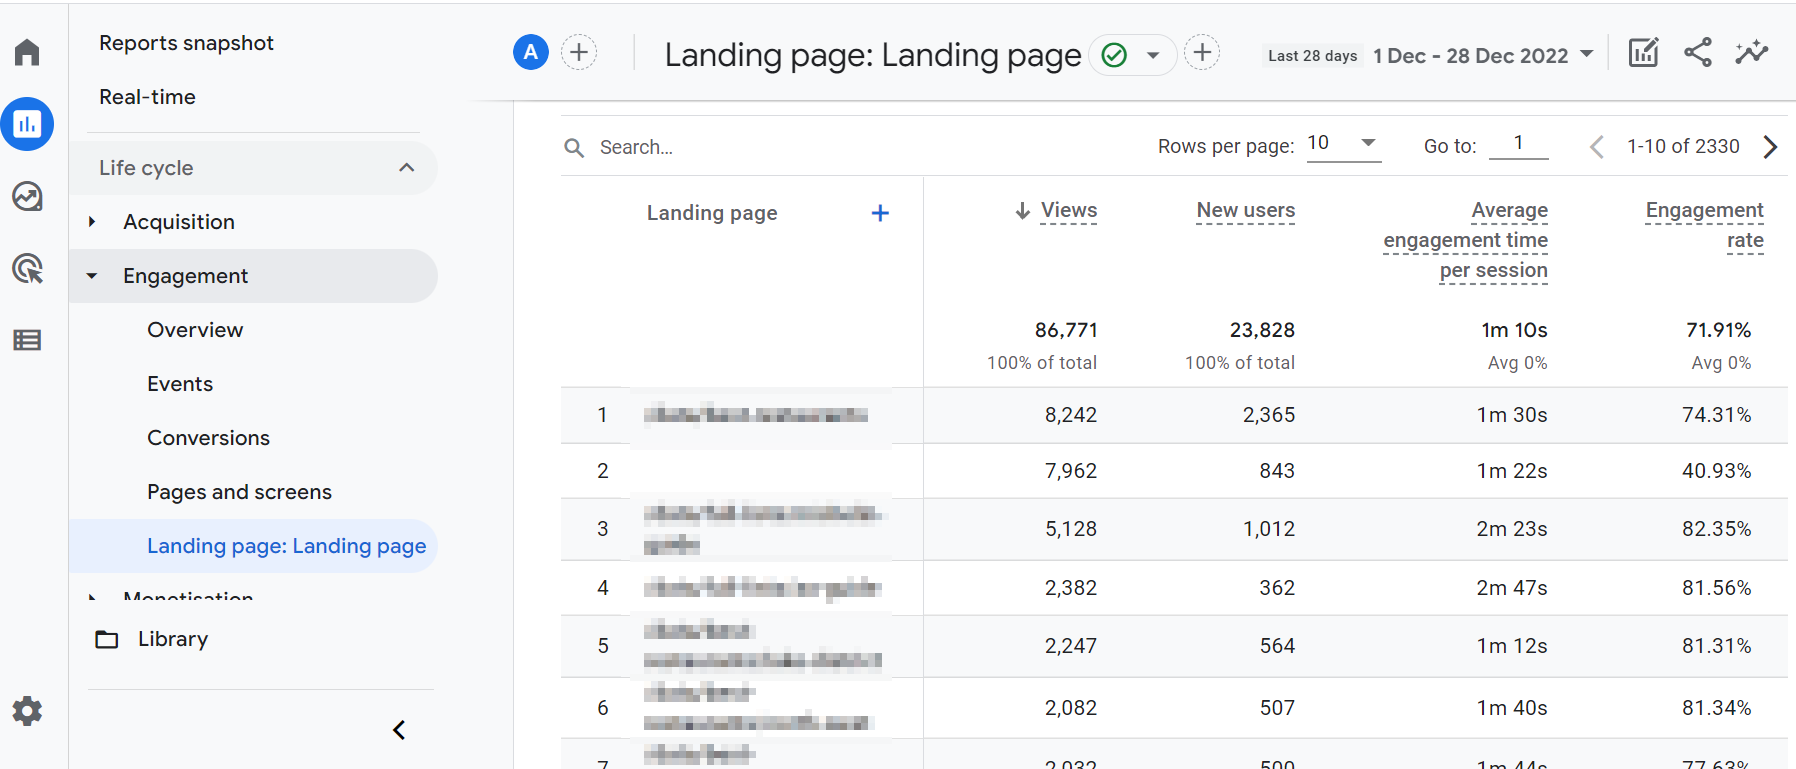
That was the case for a long time when looking for a landing page report, but interestingly whilst I was writing this post, Google freakily read my mind and added a new landing page report in December 2022, more than 2 years after GA4 was released. It can be found under Reports -> Engagement -> Landing page:
By default, the report columns don’t include the engagement rate percentage, but this can be added fairly easily via the customise report option:
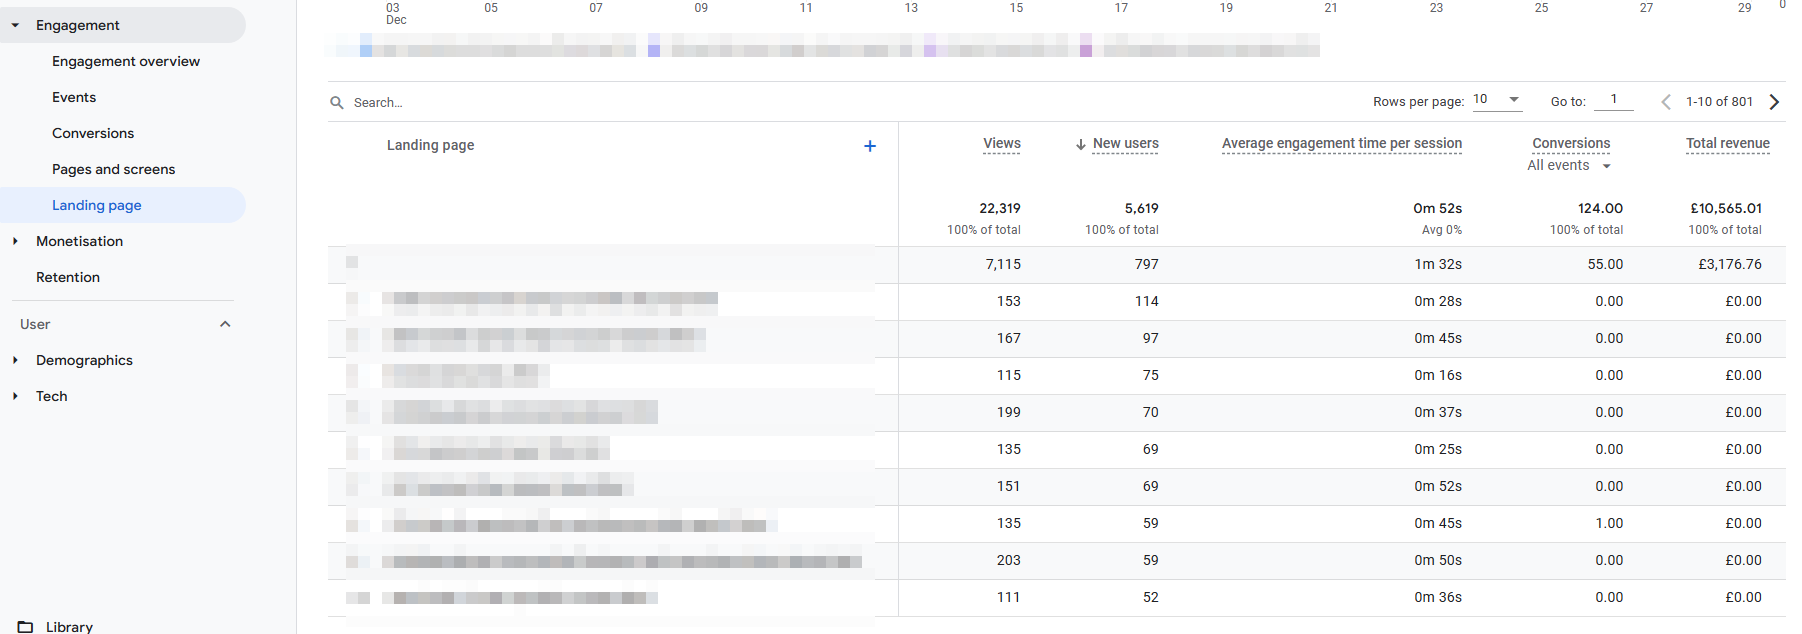
Although a landing page report now exists, you may still want to make a copy tailored to your needs in the Explorations section of GA4. For a lot of data insights, I generally find Explorations a much tidier route than trying to hack the pre-built GA4 reports.
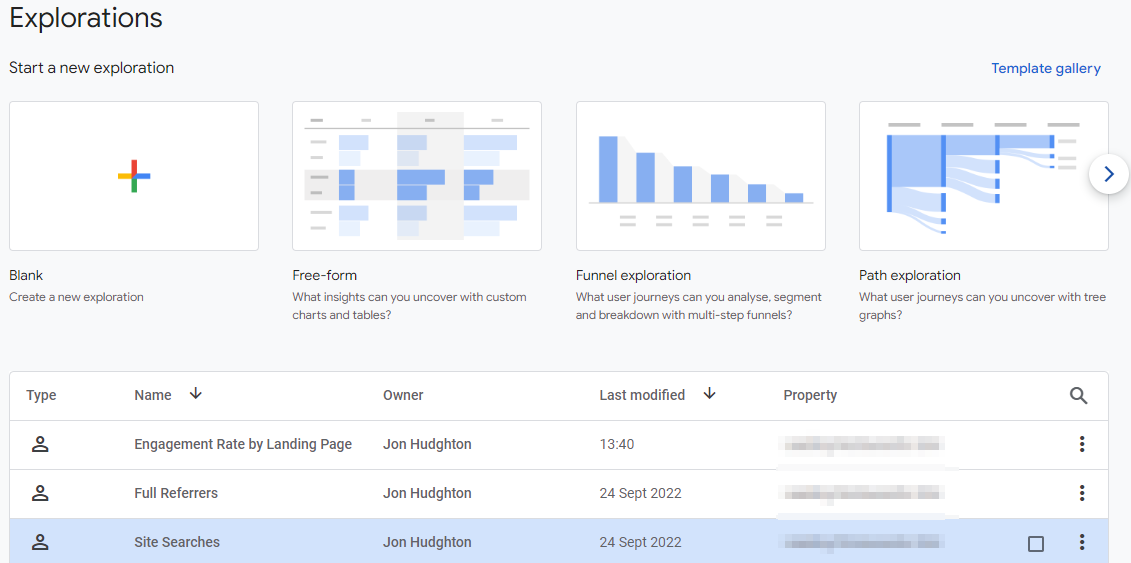
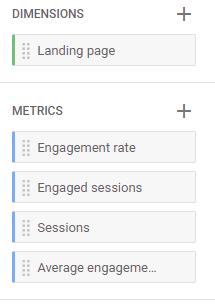
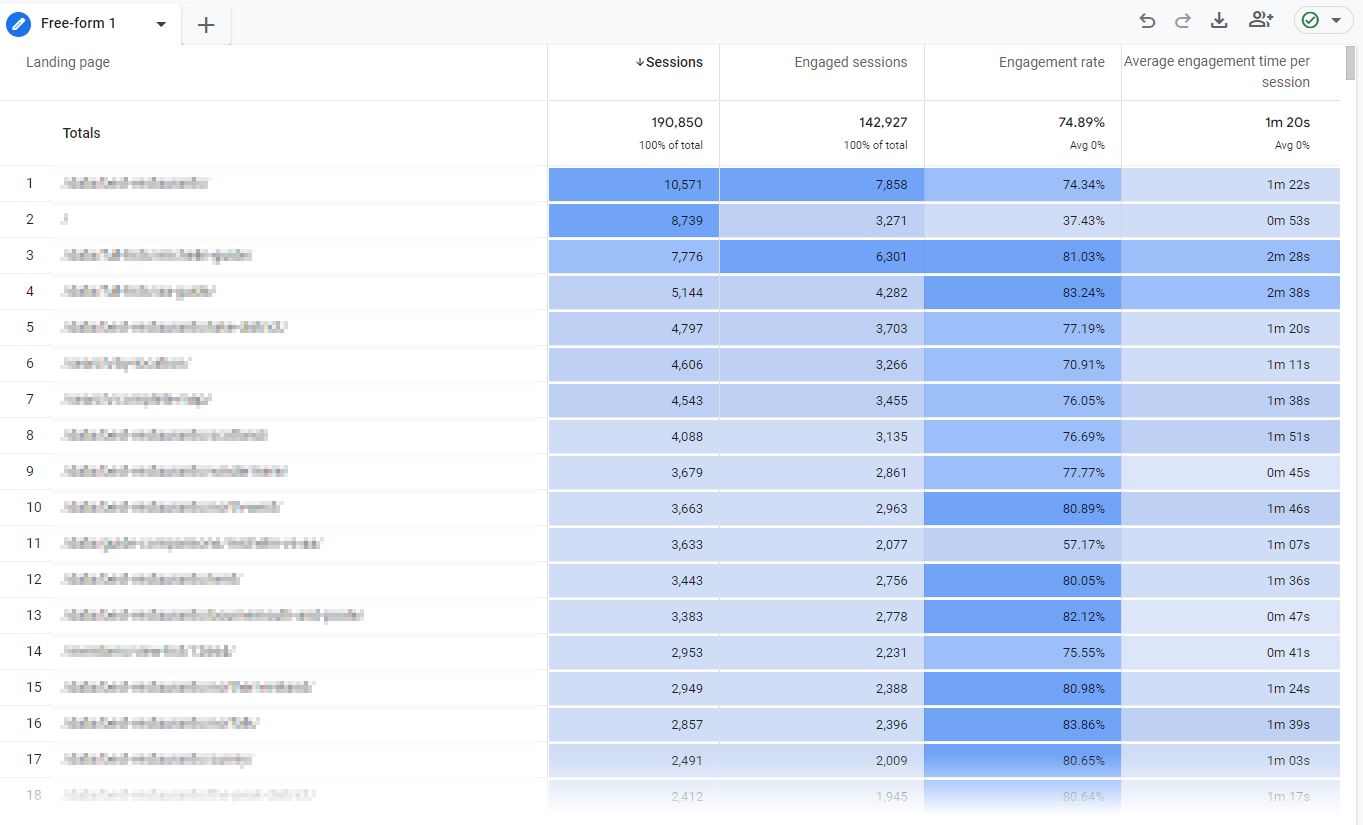
My simple landing page exploration uses the landing page dimension and I include metrics for engagement rate, engaged sessions, sessions and average engagement time per session. You can of course easily add other metrics if you like.
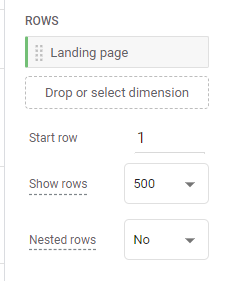
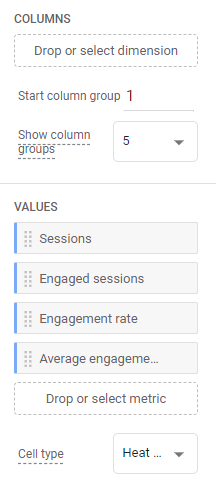
I also include a filter to exclude any “(not set)” landing pages and also only include pages with over a certain number of sessions. The end result is an easy to digest data table like the below:
It’s as simple as that! I genuinely couldn’t tell you why it took Google more than 2 years to add a basic landing page report to GA4, but using the Explorations functionality makes obtaining this data relatively straightforward once you know the steps.
Will Google change how engagement rate works in GA4?
I’d be very surprised if Google changes the core mechanics behind how engagement rate is calculated for GA4; that will hopefully come in a future version of Google Analytics (I’m going to go out on a limb and give the next version the codename… GA5).
What I think is more likely is more reports being added to the core report suite featuring engagement rate, although given how long it took Google to add the landing page report, I wouldn’t expect those reports to appear any time soon (sorry).
0 Comments